DLC Ticketing- Reporting
ServiceNow has powerful reporting capabilities that can help give higher level and granular views of your business. Below we'll go over simple examples of some of the more utilized types of reports and how they can be used in your day-to-day.
On this page:
How to create
Members of an assignment group are able to build reports from scratch using the Report Designer or based on existing queries from the list view.
Report Designer
From the left-hand navigation pane, you can expand Reports and see View/Run and Create New. If you click on View/Run you're able to see your own reports as well as those from your Group and All. Depending on the permissions of these reports you may not see any of the underlying data.

Once you click Create New you'll be taken to the Report Designer, if the page does not match the screenshot below there should be a button that states "Switch to new UI".
Name your report, select Table as Source type, and search for DLC Ticket.

The following page will show the query builder. Once you've entered the conditions of what you want to query click Run to show the results.

The next page will show numerous output options. For this example, we chose a bar graph, and clicking Run will again show the result.

The next two pages allow for additional configuration of the output, once complete click Save and you now have your report.

From List View
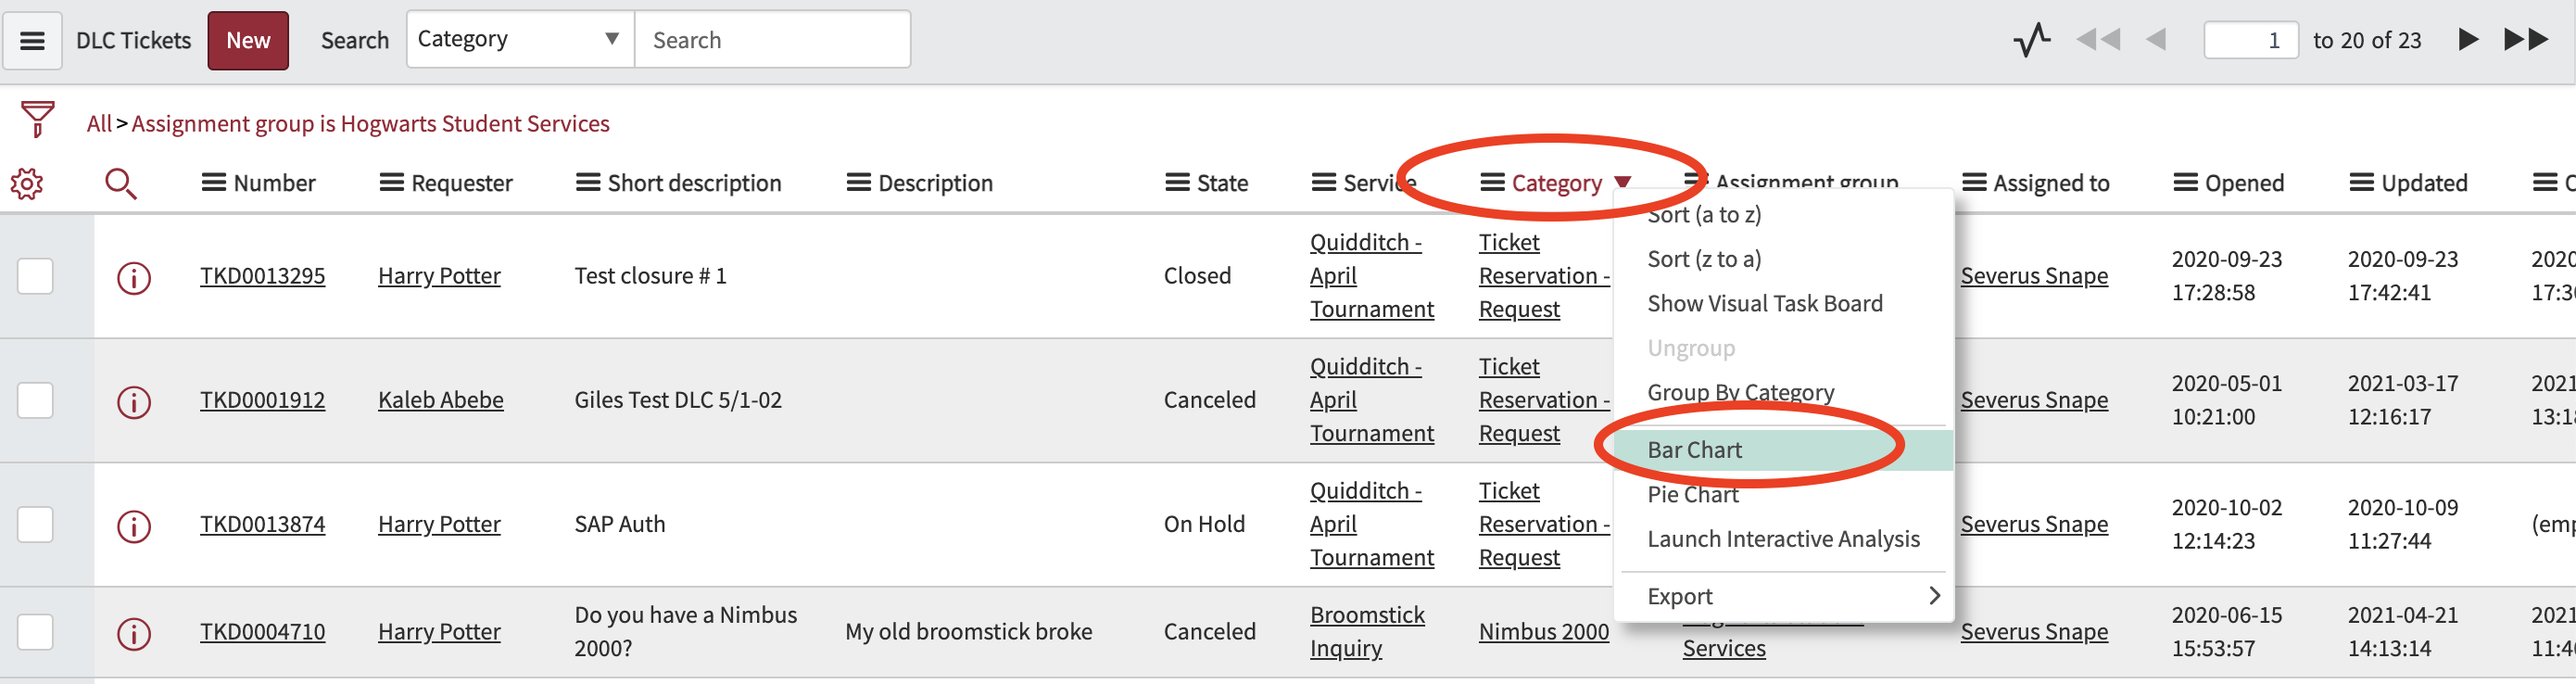
From an existing query right-click on the column you wish to report against, in this example we chose Category. Click on Bar or Pie chart and this will take you to the Report Designer with a ready-made report.

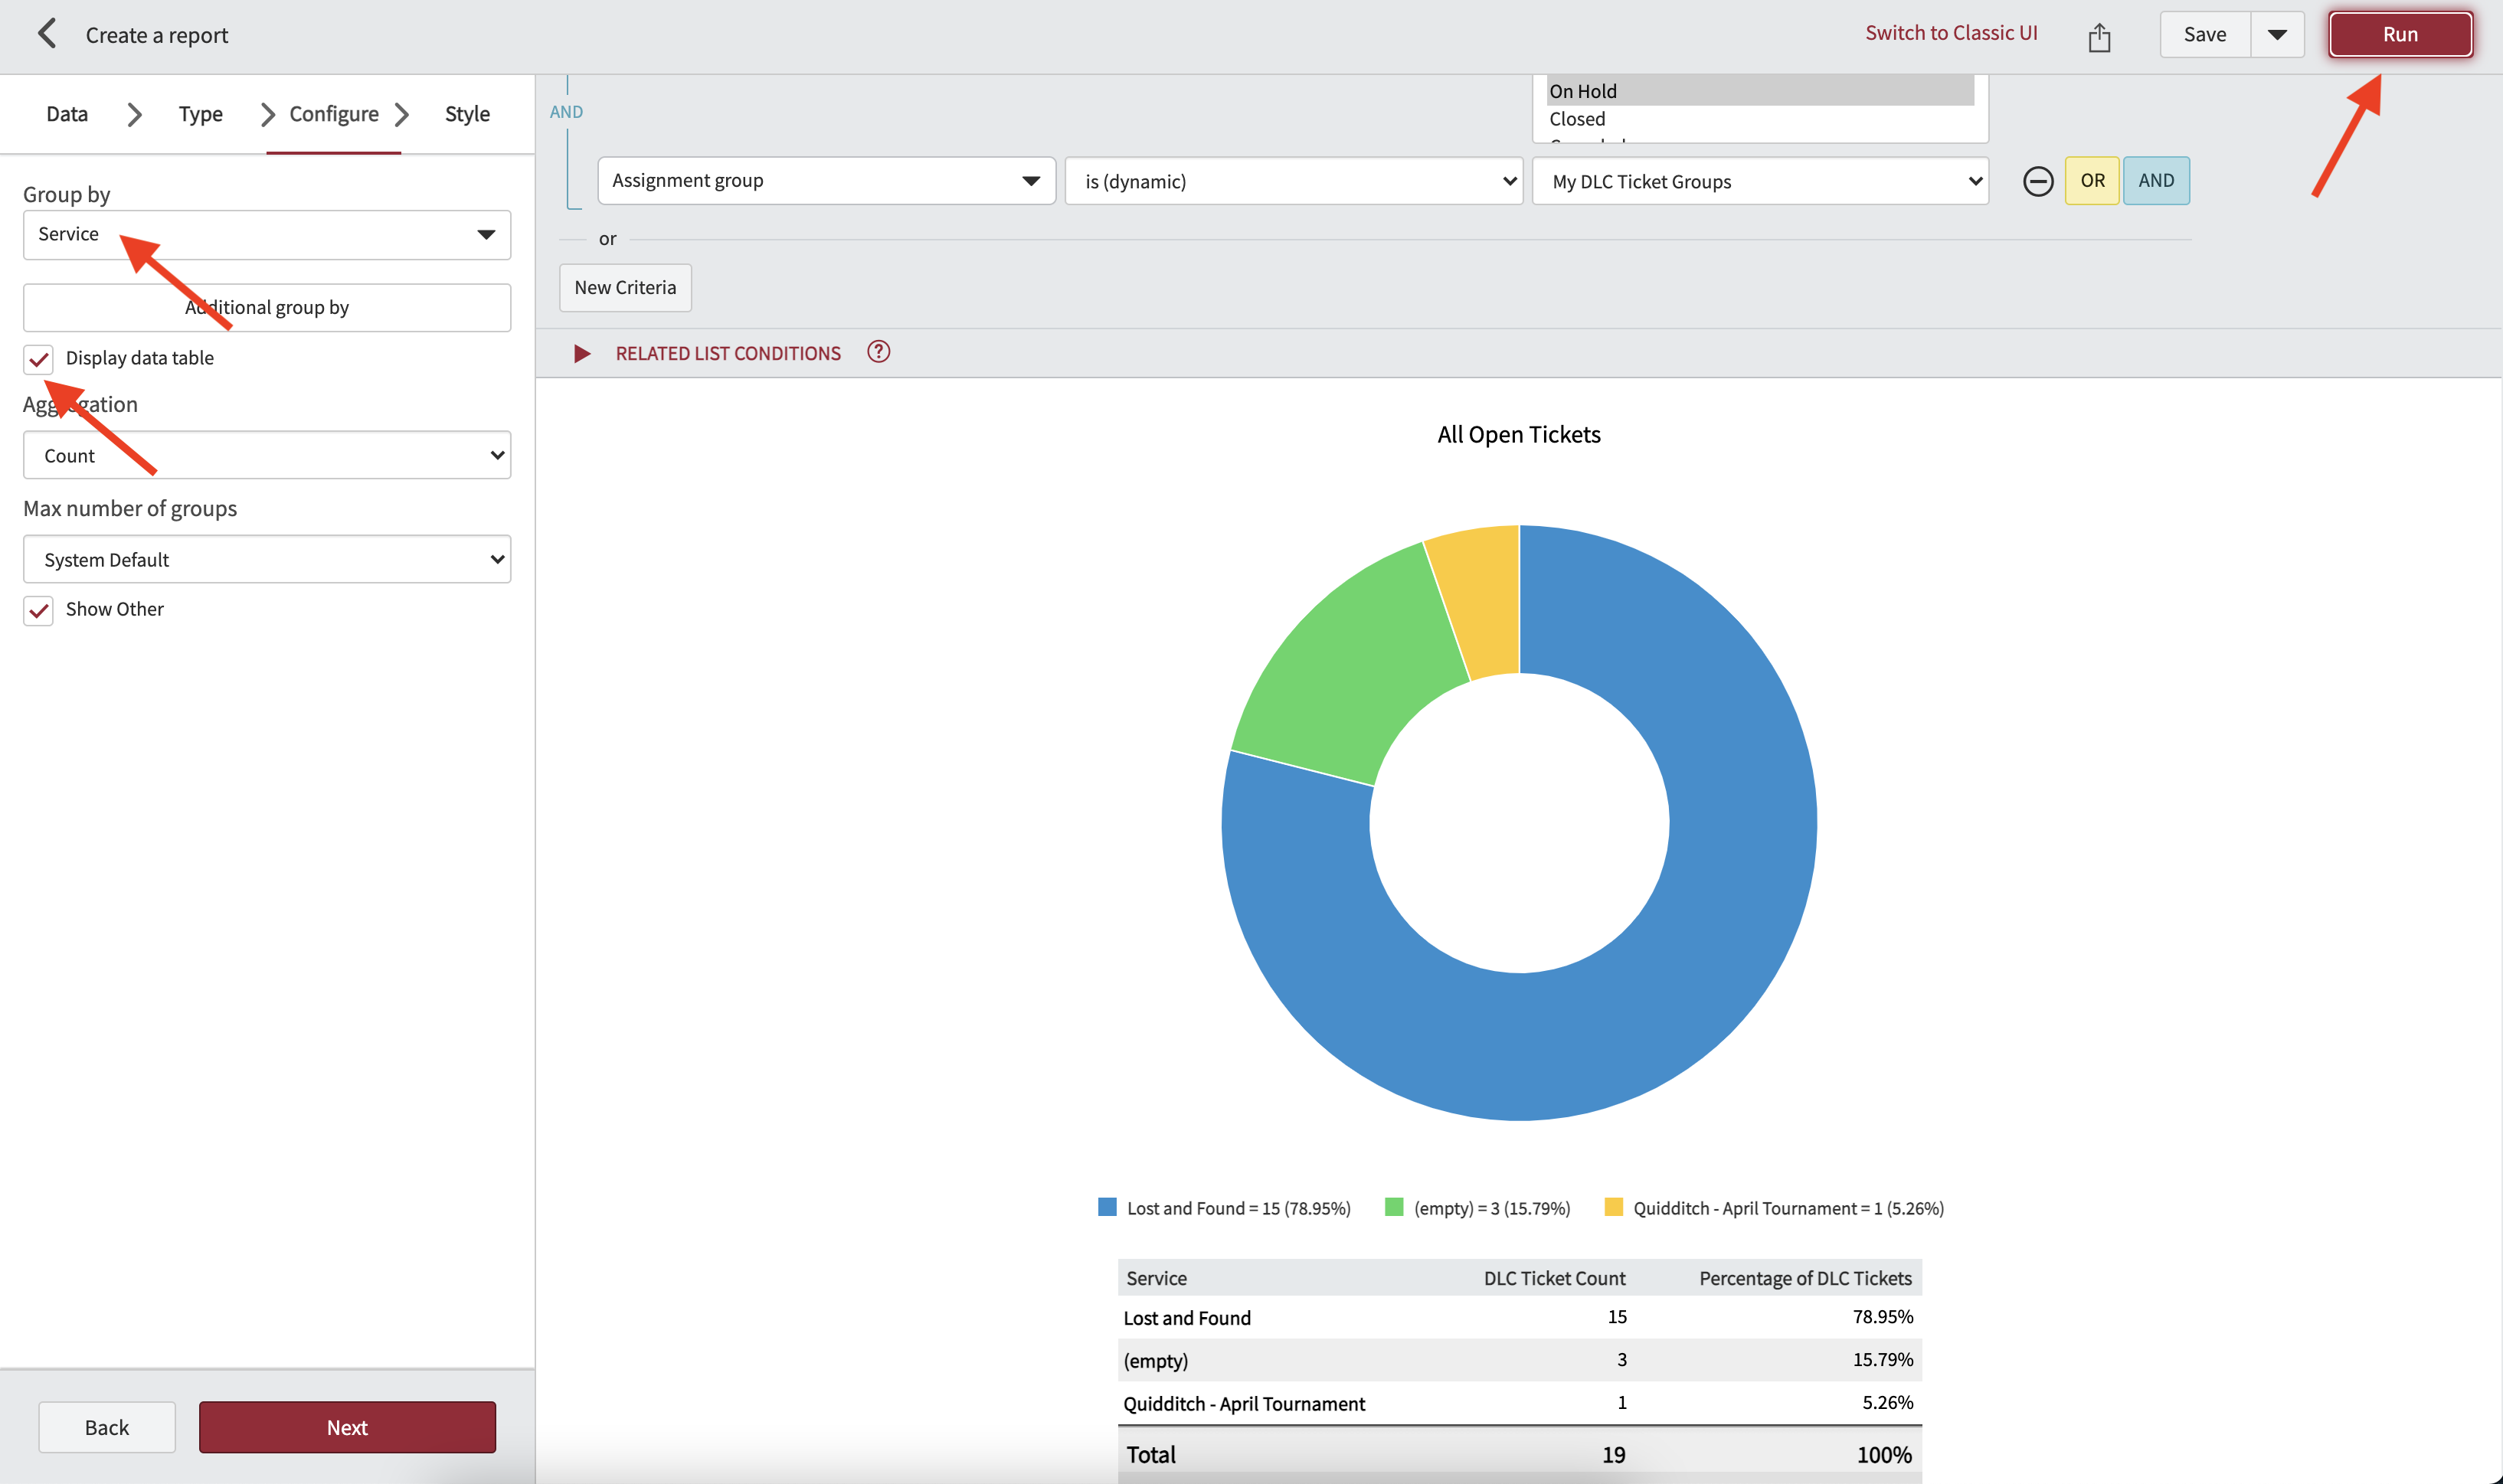
Measuring totals
From the Report Designer create a new report, for this example we will look at all of the currently open tickets in our queue.
- Name the report, select Table for Source Type and DLC Ticket for Table.
- On the next window select the output you wish, you can opt for just a text readout or something more visual like a pie chart.

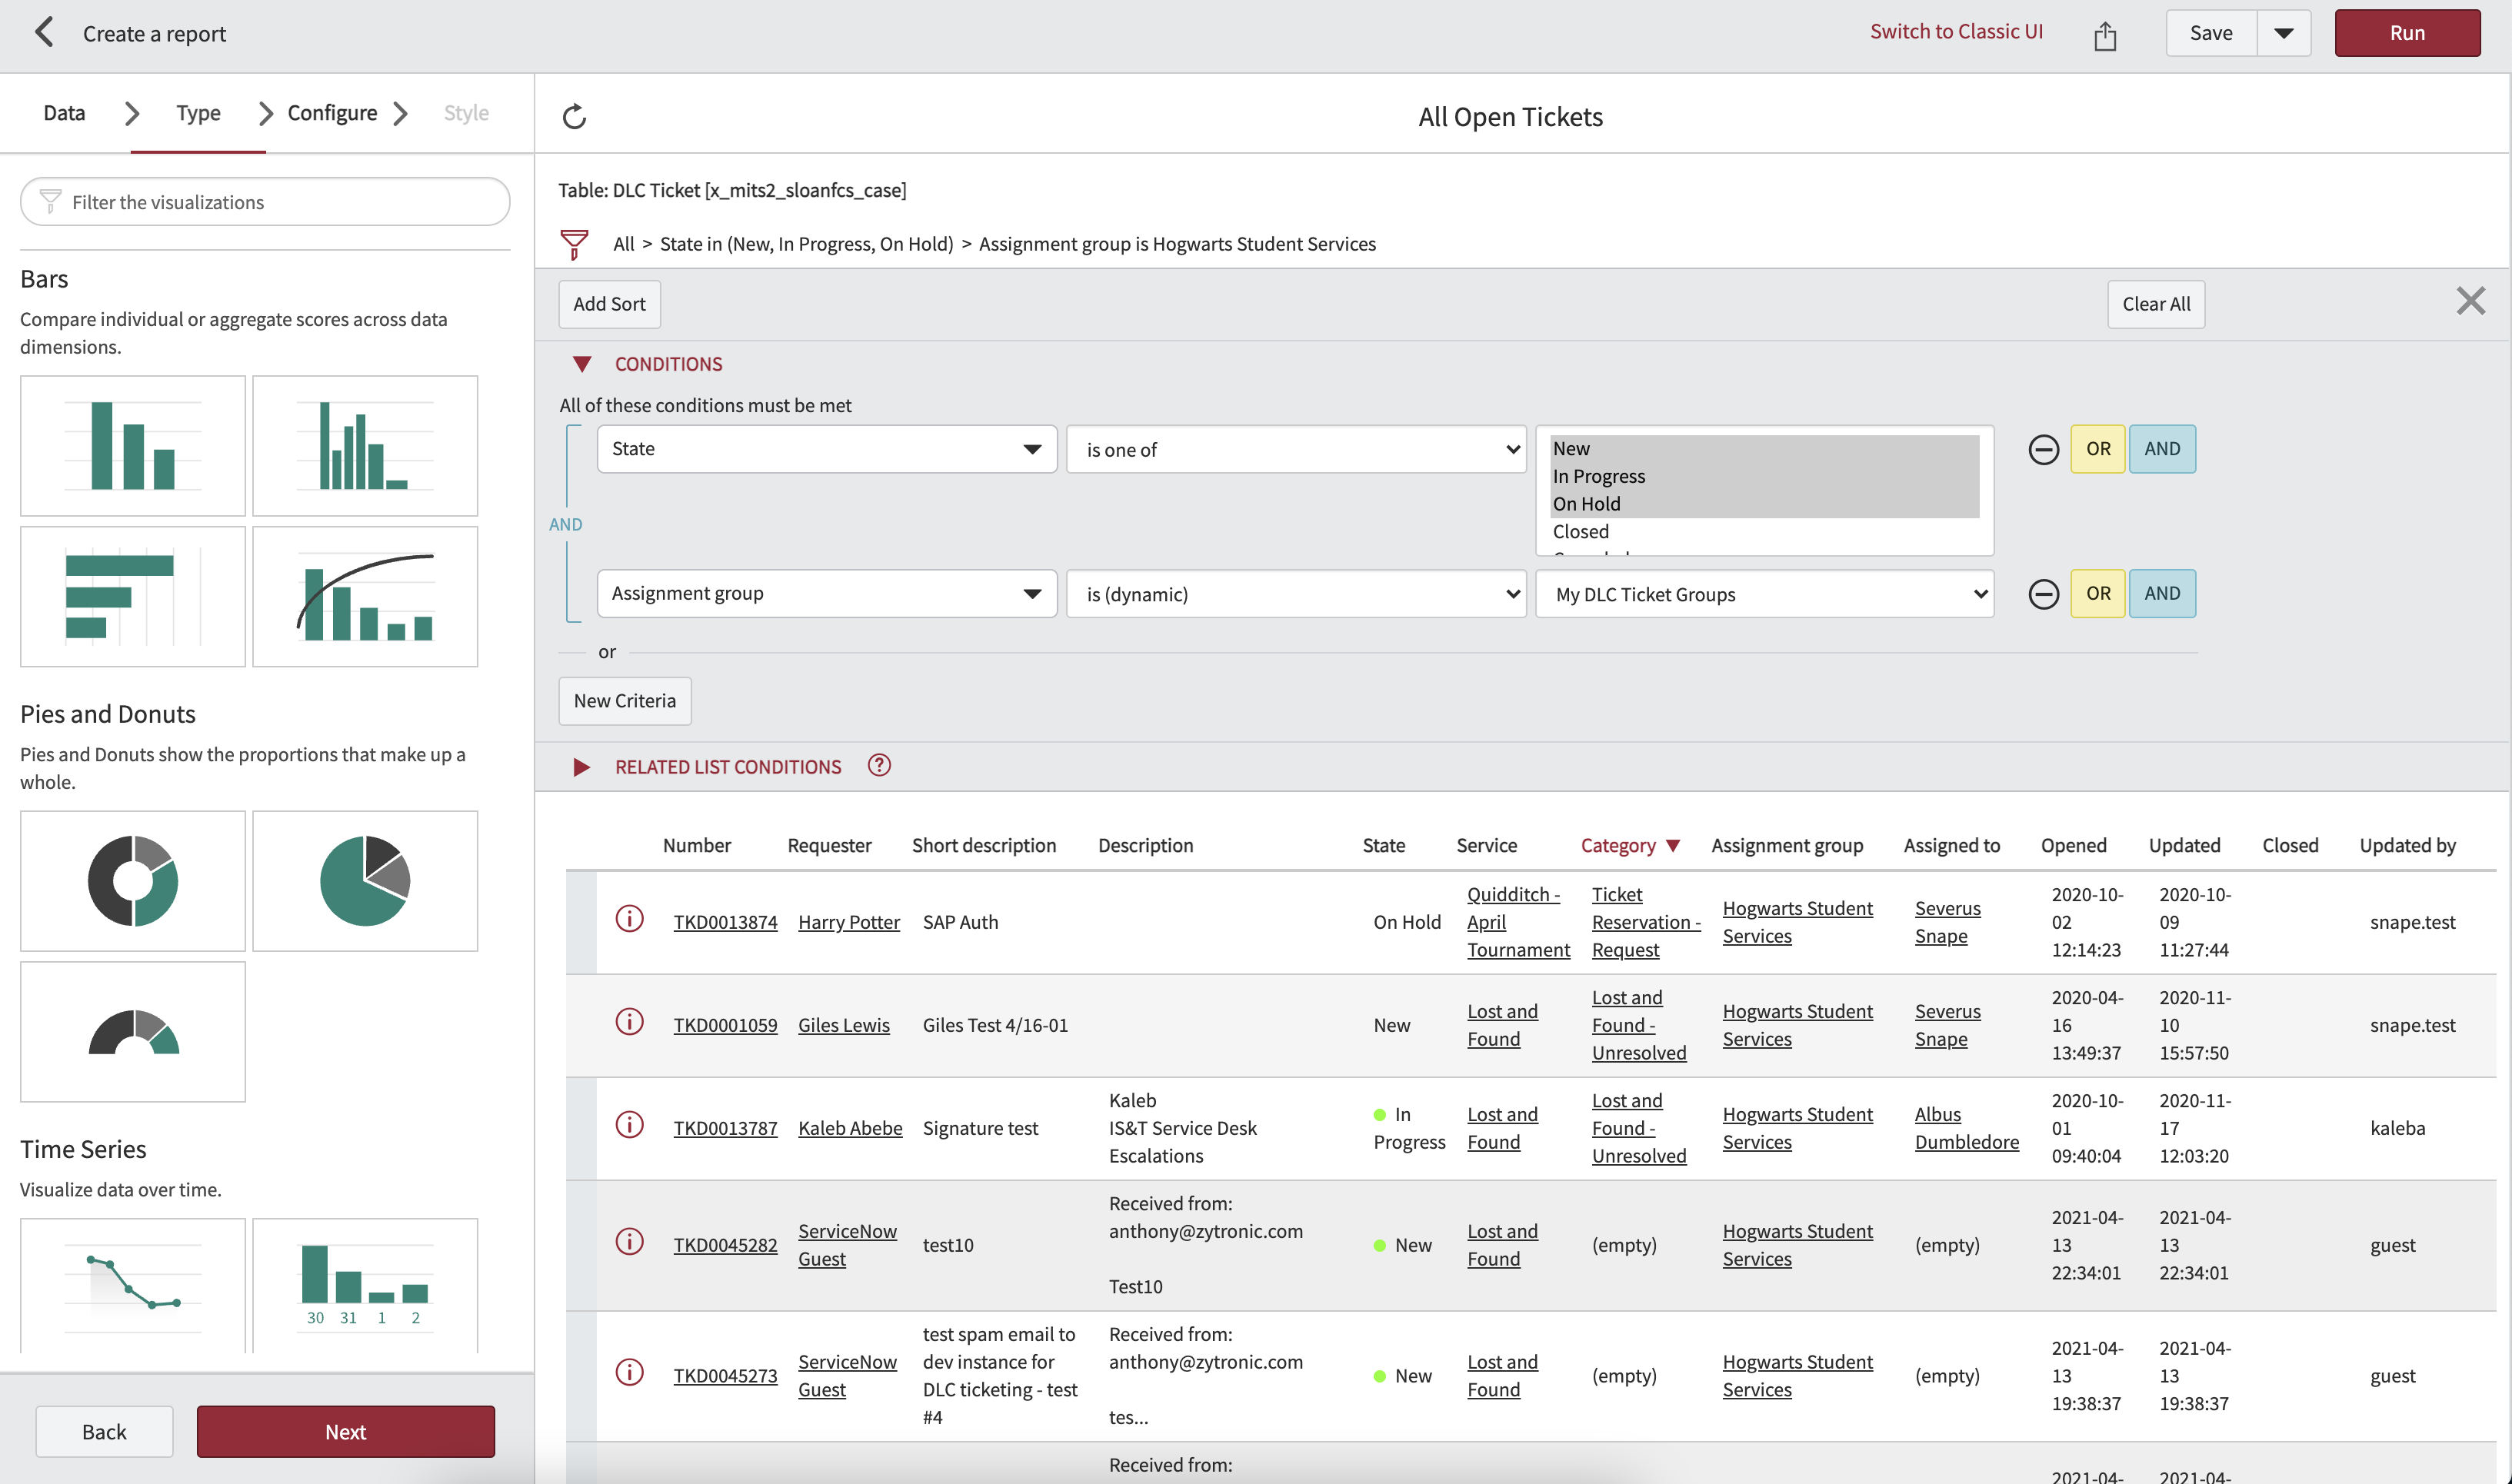
- Once you've selected your output and clicked Run the next window will allow you to customize the report further, including allowing you to change how to group the information and also showing you a table of the underlying data.
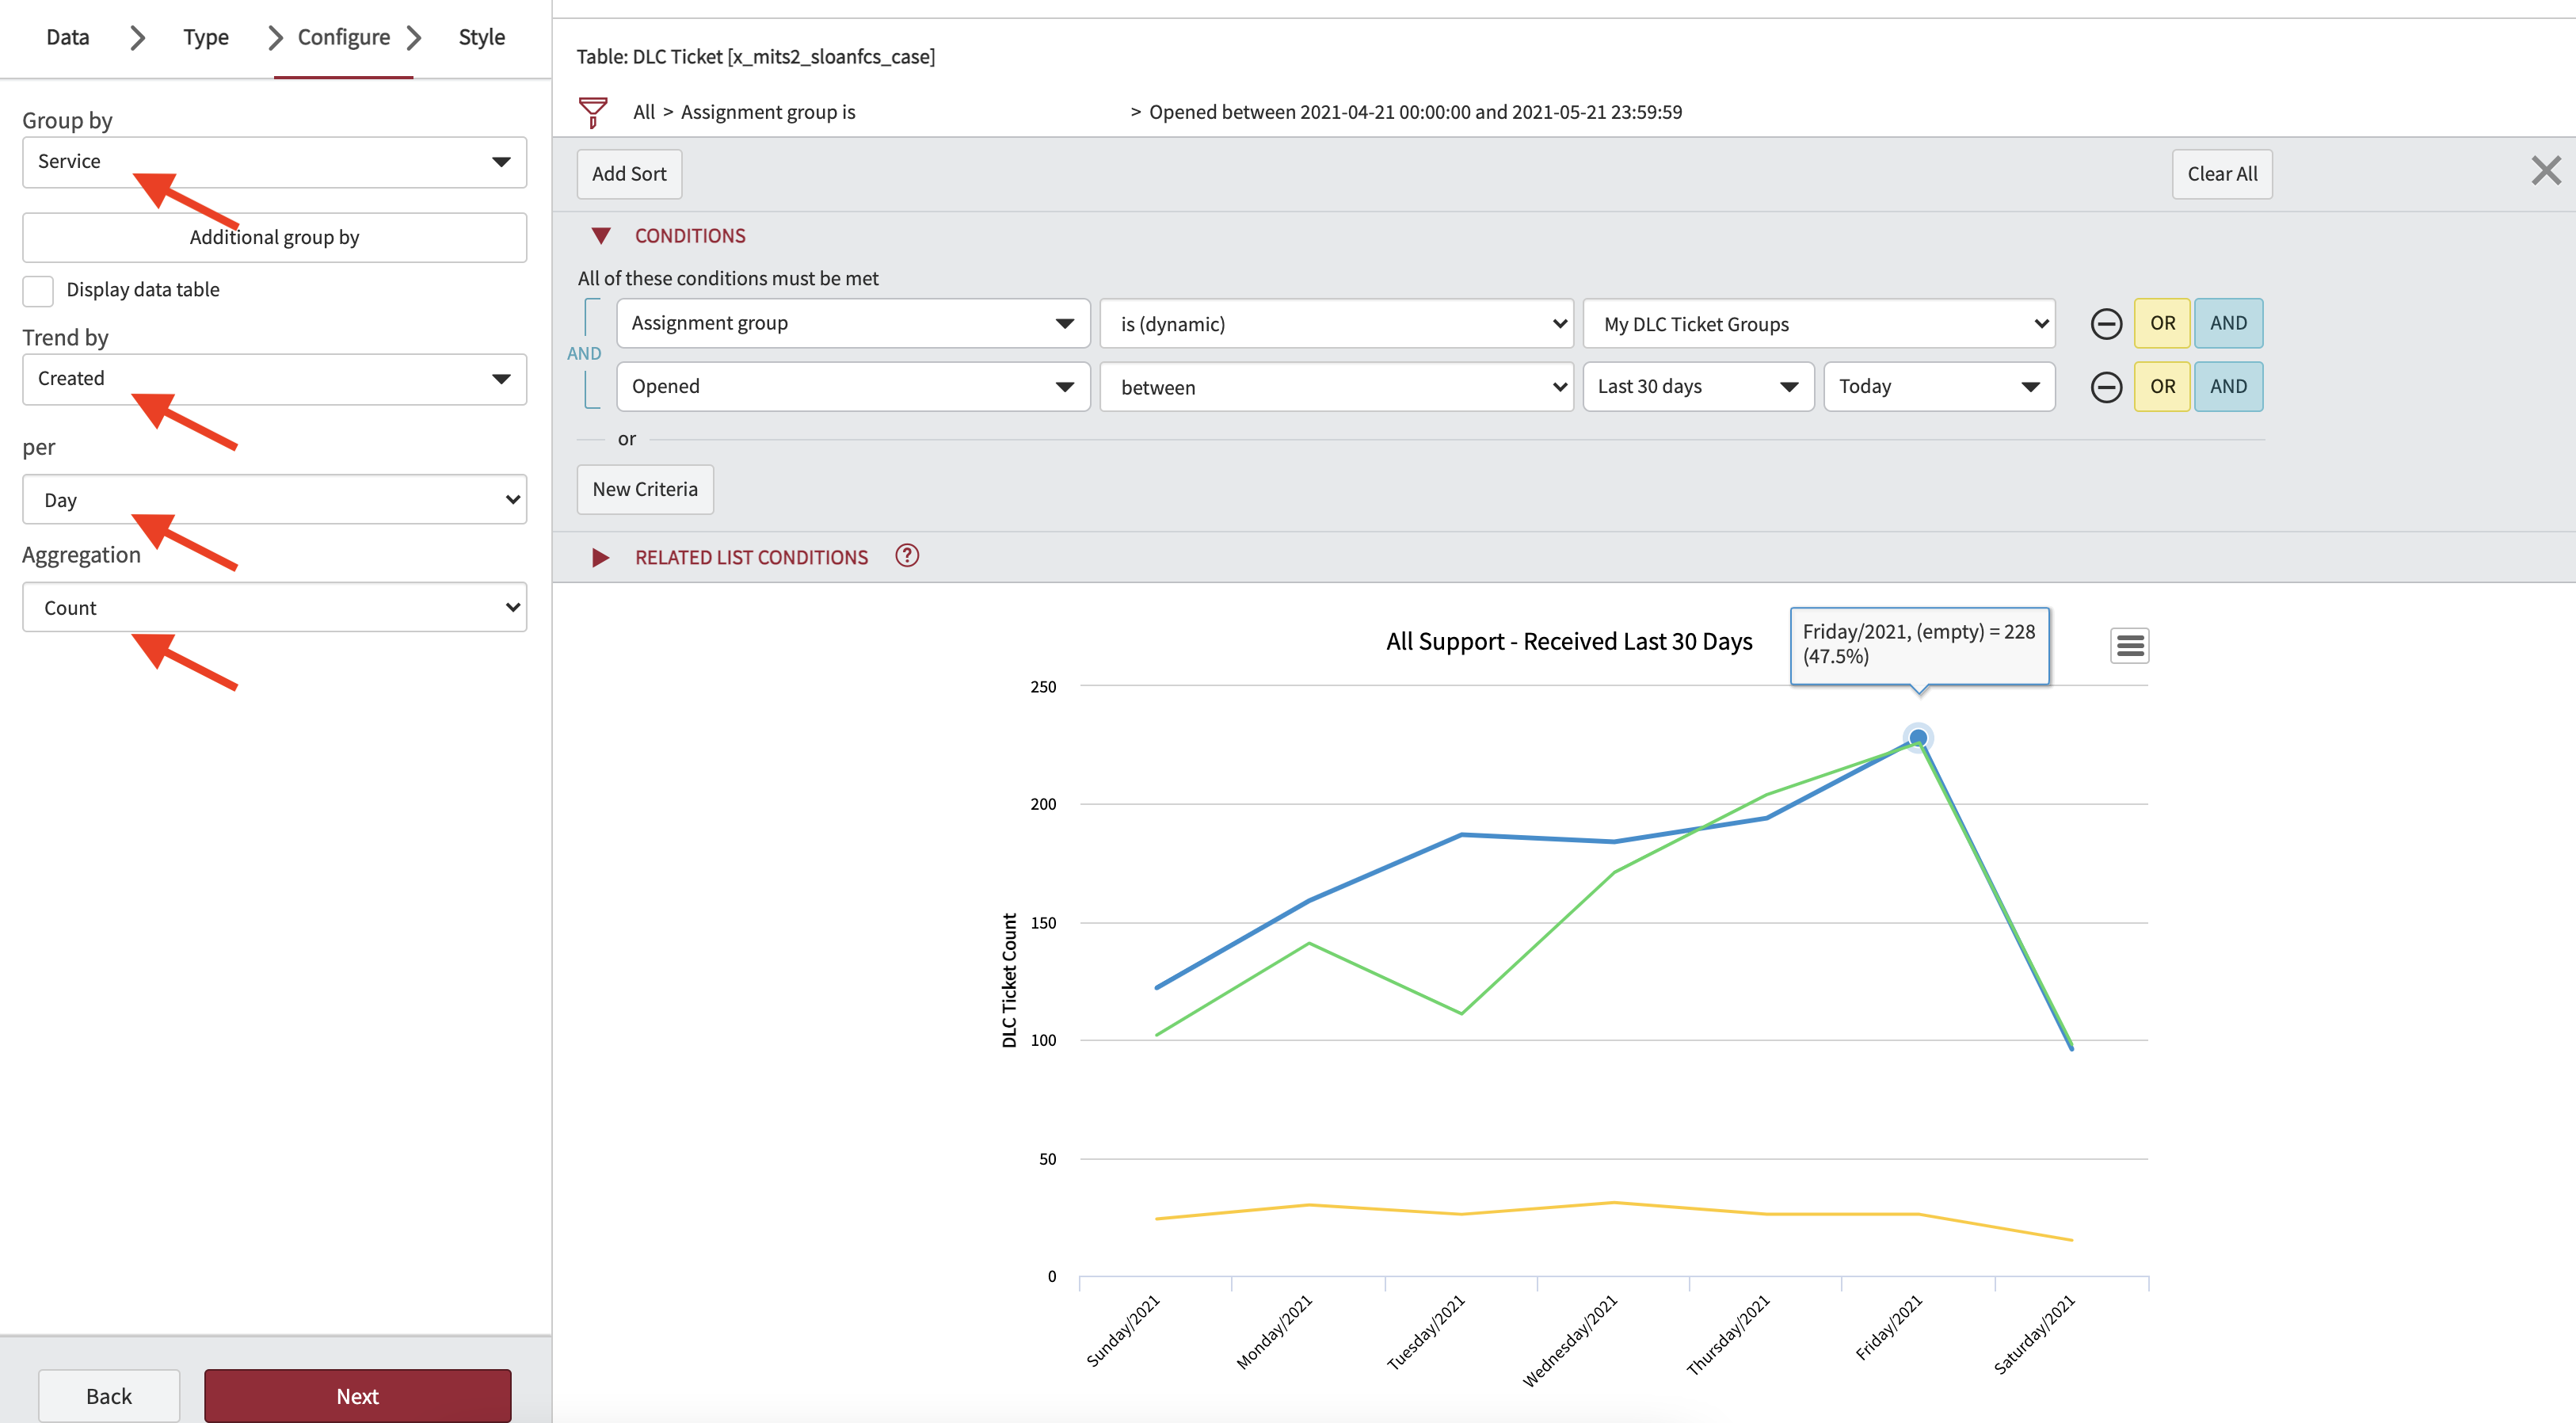
Capturing trends
When capturing trends you'll need to alter the report configuration to show changes in time for as far back as needed. In this report, we are looking at all tickets open within the past 30 days, displayed as a line graph, and grouped by Service.
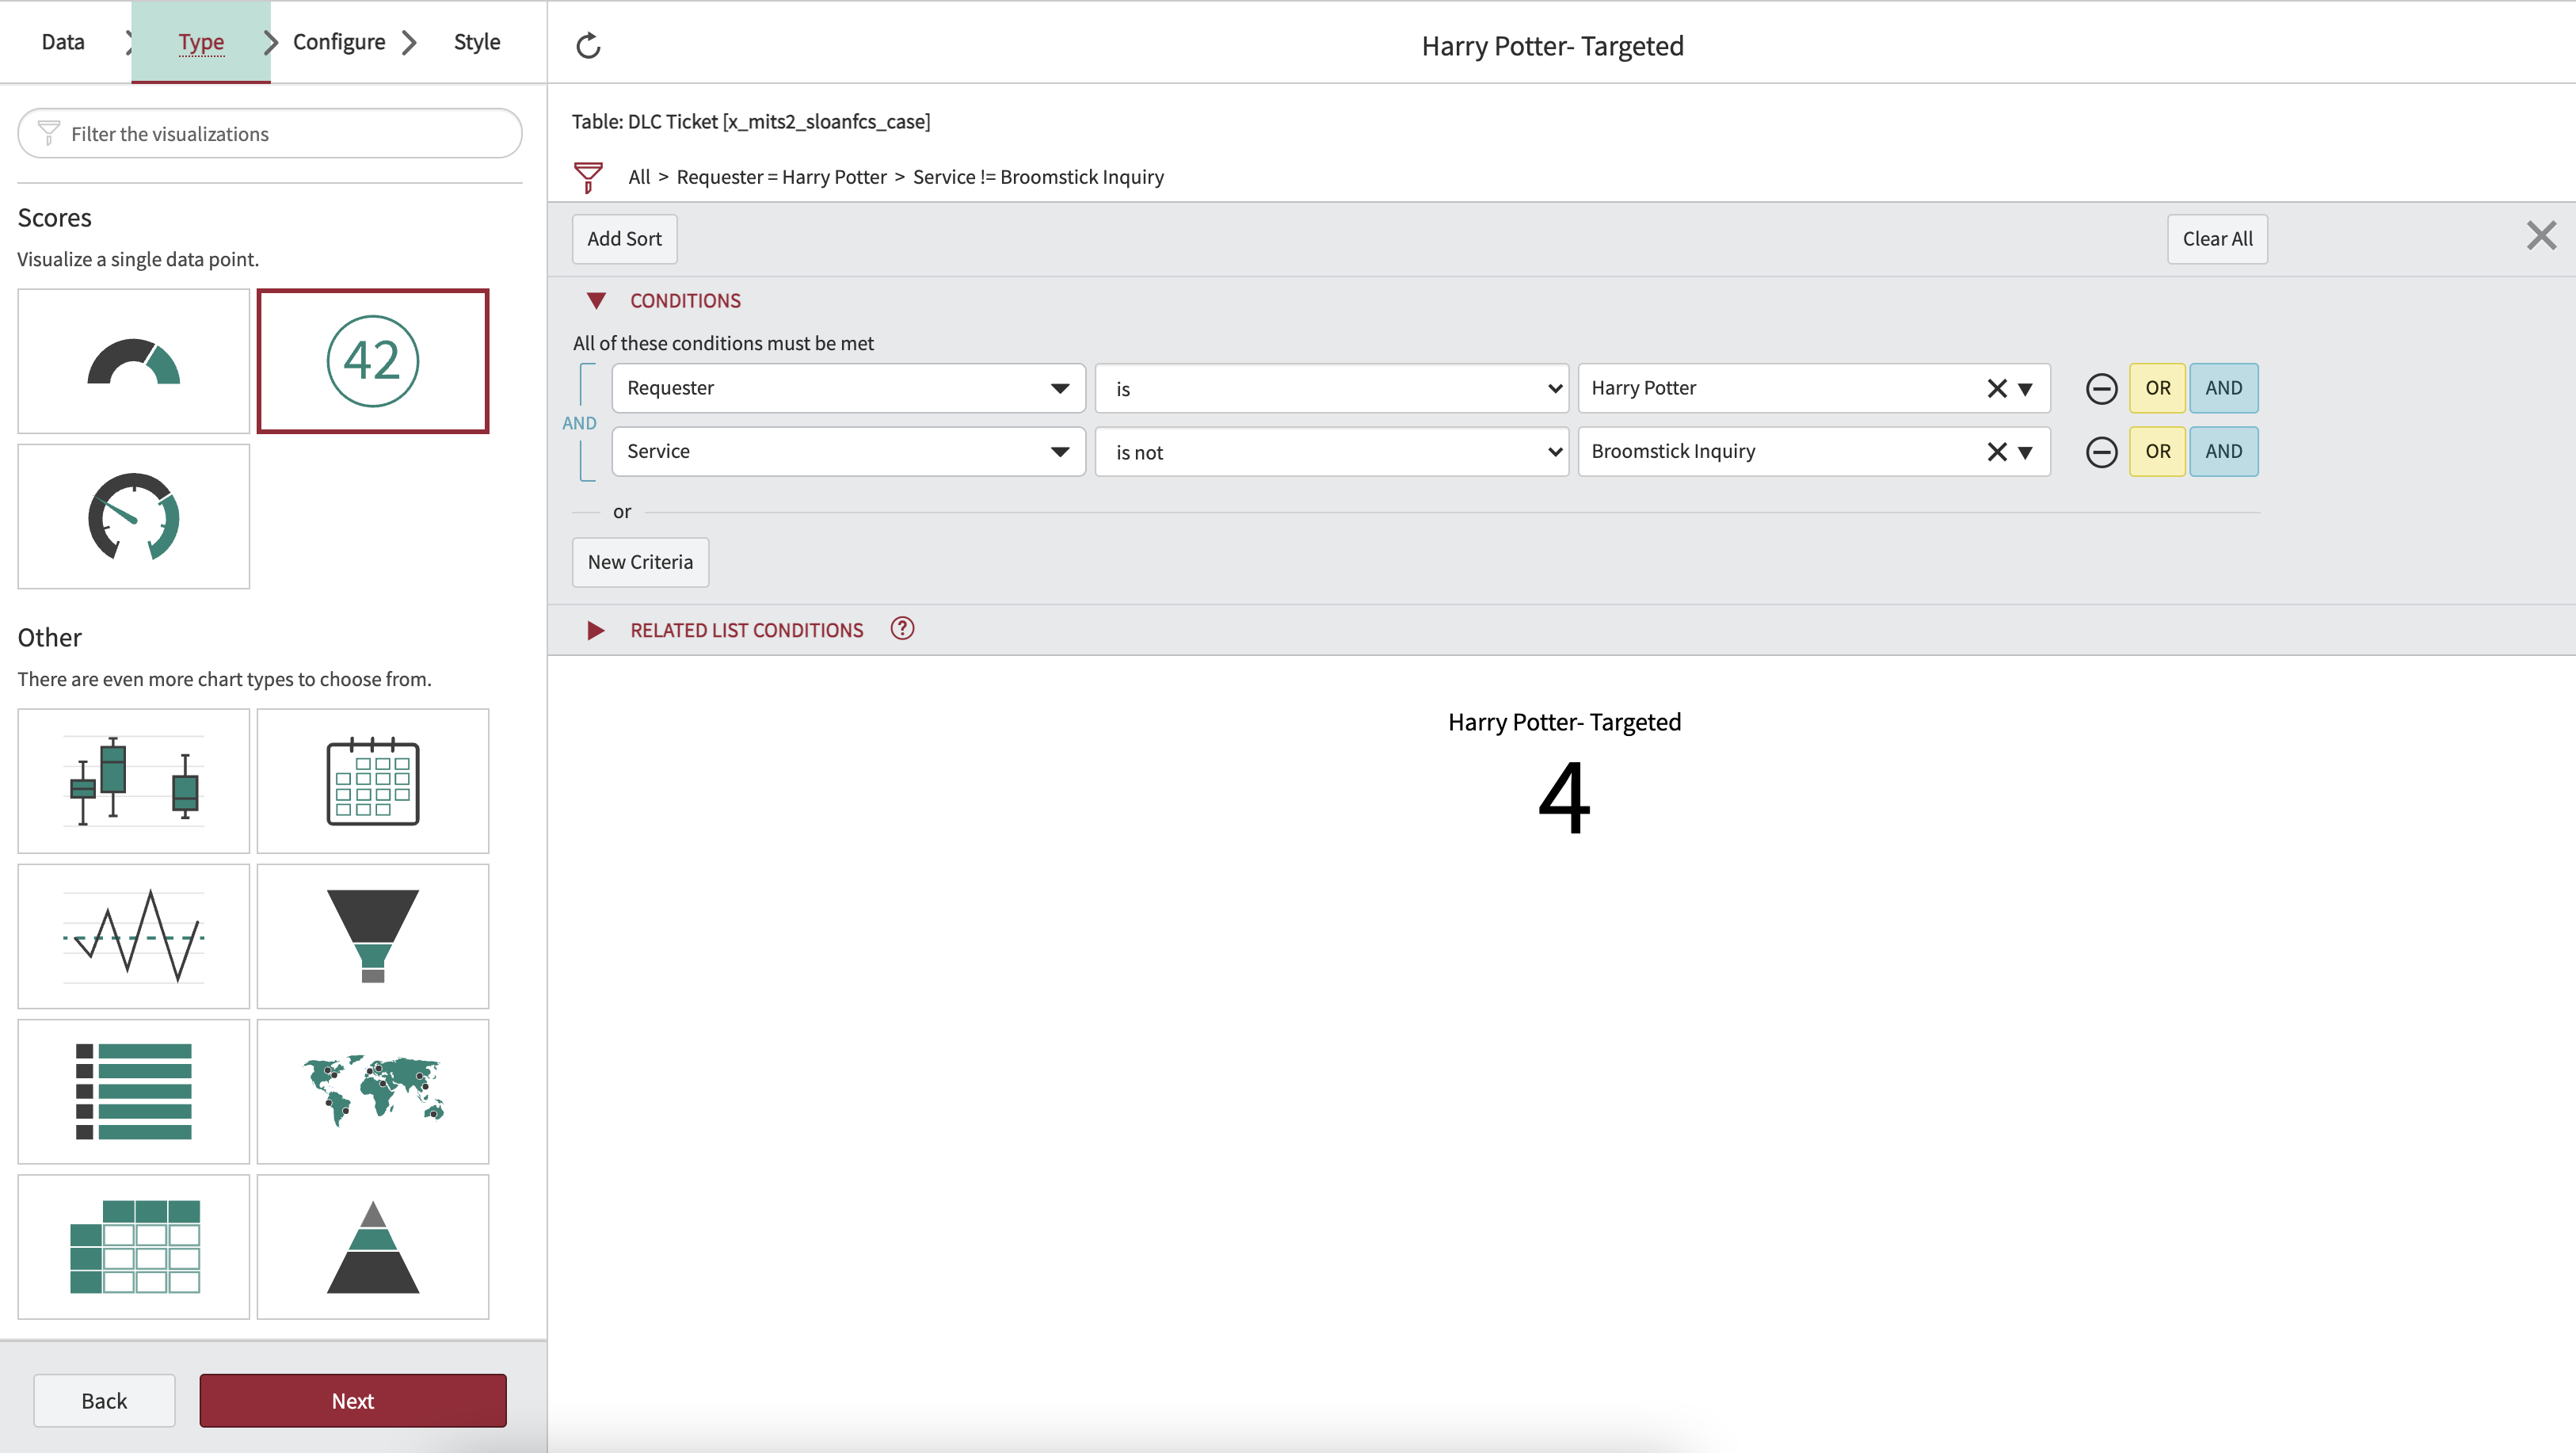
Targeting specific data
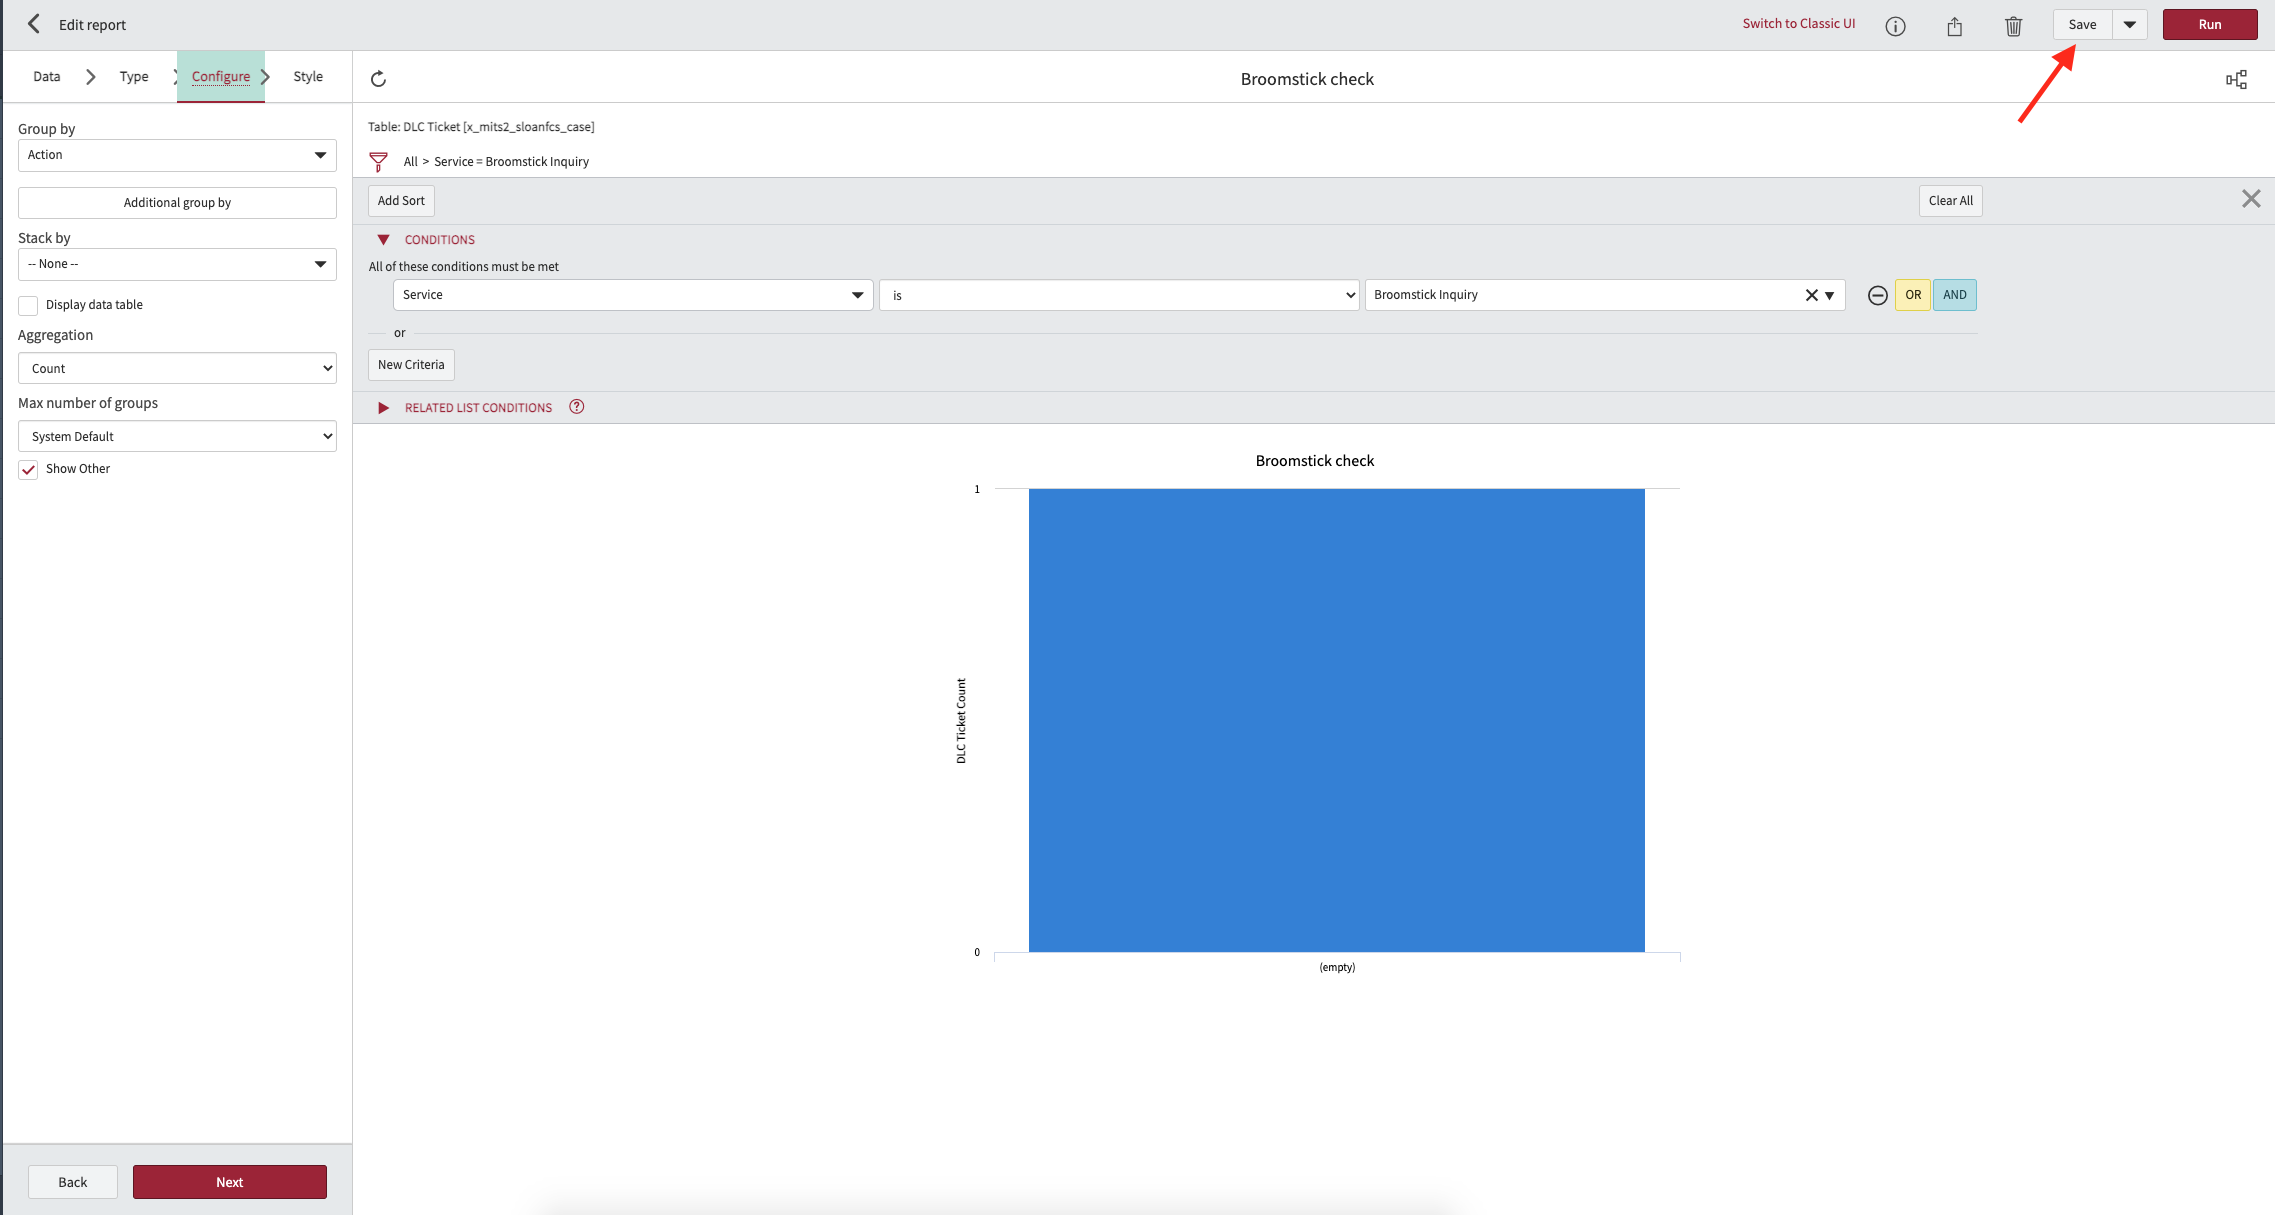
In some cases there may be a specific catalyst that requires you to have a narrowly scoped report; exclusions can be helpful in removing unwanted data. In this example, we want to show all tickets opened by Harry Potter but not show any that have Broomstick Inventory as a Service.
Drill down reports
Some reports can be used to provide a broad overview while also allowing you to drill down to see specific subsets of data. In this example we are showing all the tickets in two separate assignment groups categorized by Service, and clicking on a Service will show a separate report broken down by Category.
Note: The top-level report must be saved before creating the Drill Down report.

Name the drill down report, in this case it was named Tickets by Category and grouped by Category.
Note: When you run this report you'll see data from all DLC Ticketing Queues, this is by design. You won't be able to view the underlying
data.

From the original report now if you click on one of the pie charts it will take you to the drill down report showing additional information.

Additional features
These are some miscellaneous features we wanted to call out;
- From the List View you can right-click under a column and Filter Out or Show Matching the entry from that column. This will exclude (Filter Out) or only show (Show Matching) records based on your selection.

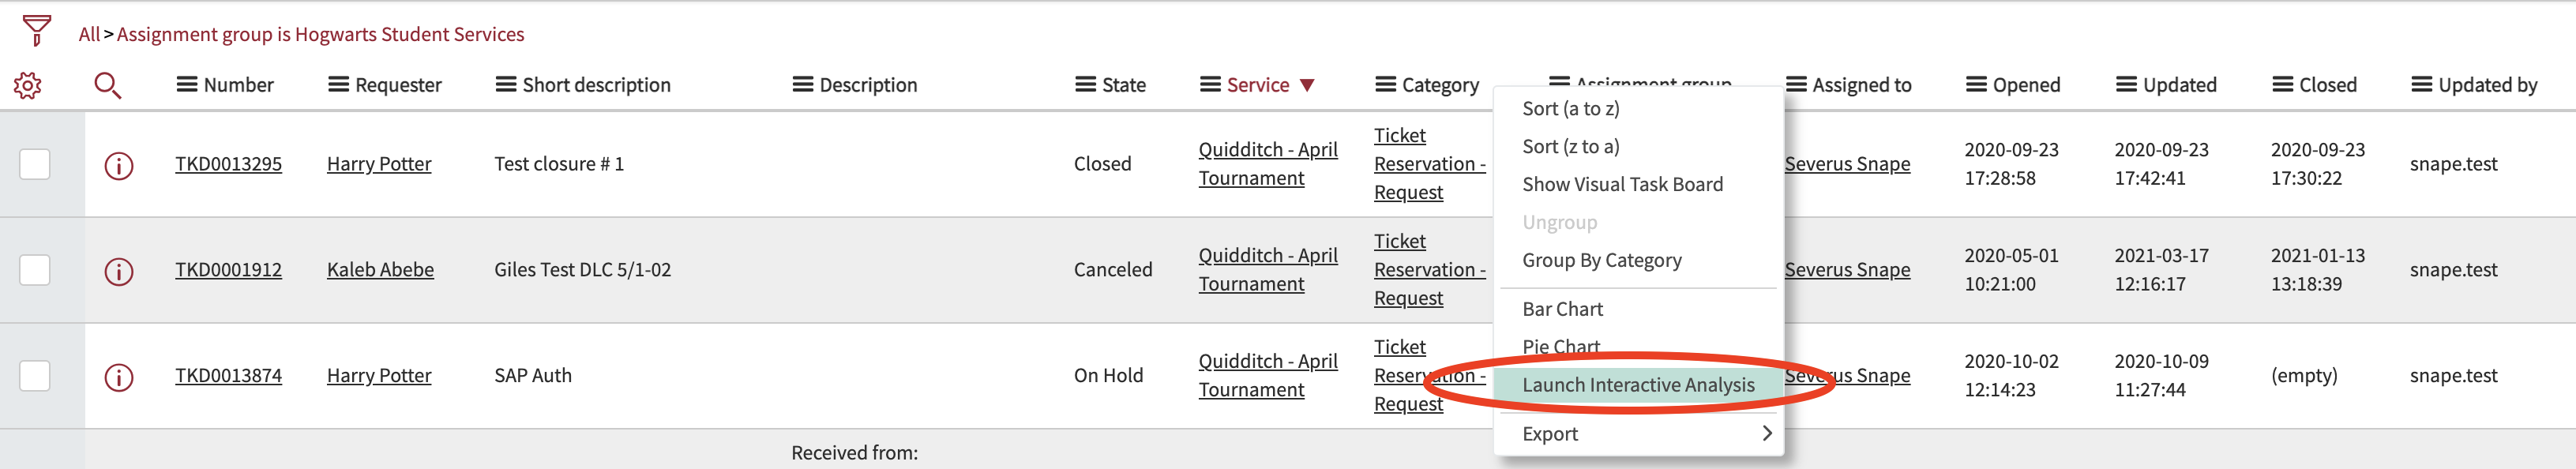
- Interactive Analysis is another way to parse out a large number of records quickly. From the List View right-click on a column heading and select Interactive Analysis, this will generate a report that is automatically grouped by that column.